At the time of writing this, the bill
H.R. 1 has passed in the US house of representatives, though in the senate it has not seen a vote, which has as one provision a requirement that federal congressional districts for every state be drawn up by an independent commission, rather than by their state houses. 7 states already have this requirement in place for federal congressional districts,
[1]Arizona, California, Hawaii, Idaho, Montana, New Jersey, and Washington while 13 use independent commissions to draw up their state legislative districts.
[2](Includes all 7 in footnote [1])Alaska, Arizona, Arkansas, California, Colorado, Hawaii, Idaho, Missouri, Montana, New Jersey, Ohio, Pennsylvania, and Washington I'll touch back on these states later, but since there's no commission more independent than mathematics, I decided to see how well an algorithmic solution to redistricting could do in preventing gerrymandering.
I mentioned one proposed algorithm for redistricting, the
Shortest Splitline method, in a
previous post, but this time I opted to use
Balanced Centroidal Power Diagrams, described in
this paper written by Vincent Cohen-Addad, Philip Klein, and Neal Young in 2017. How this method works is described pretty concicely
here, though the maps below show about what it does: Districts are defined by polygons that are as compact as they can be with equal populations. I used their code, which is available
on github, to redistrict the state house and congressional districts of every state I could find 2016 presidential election data for.
[3]I got electon data from the Harvard Dataverse Repository, which was missing Alabama, Connecticut, Maryland, Mississippi, New York, Ohio, Virginia, and West Virginia.
The histograms on the left show the lean of each individual district based on how voters there voted in the 2016 presidential election, so for some the actual representative may be of a different party.
Click on the labels below to see a comparison of how elections might go with an algorithmically generated district map versus the current district maps for either the Federal or State houses:
There are a few states that I left out for the redistricted state houses: New Hampshire, South Dakota, and Vermont each have different districts elect different numbers of representatives. I think the reason South Dakota has for doing this in particular demonstrates one reason algorithmic redistricting could be a bad idea.
While the South Dakota Senate has 35 members elected from 35 districts, the House has 70 members, with 2 representatives elected from each senate district. It isn't the only state that does it this way (Arizona, Idaho, New Jersey, North Dakota, and Washington also have 2 house representatives for each senate district), but it's unique in that it splits two of the senate districts, 26 and 28, into two house districts each, so there are 33 districts with two representatives and 4 with one each. The reason for doing this is to provide more representation for the Rosebud Reservation, which makes up about half of district 26, and the Standing Rock and Cheyenne River reservations, which together make up about half of District 28.
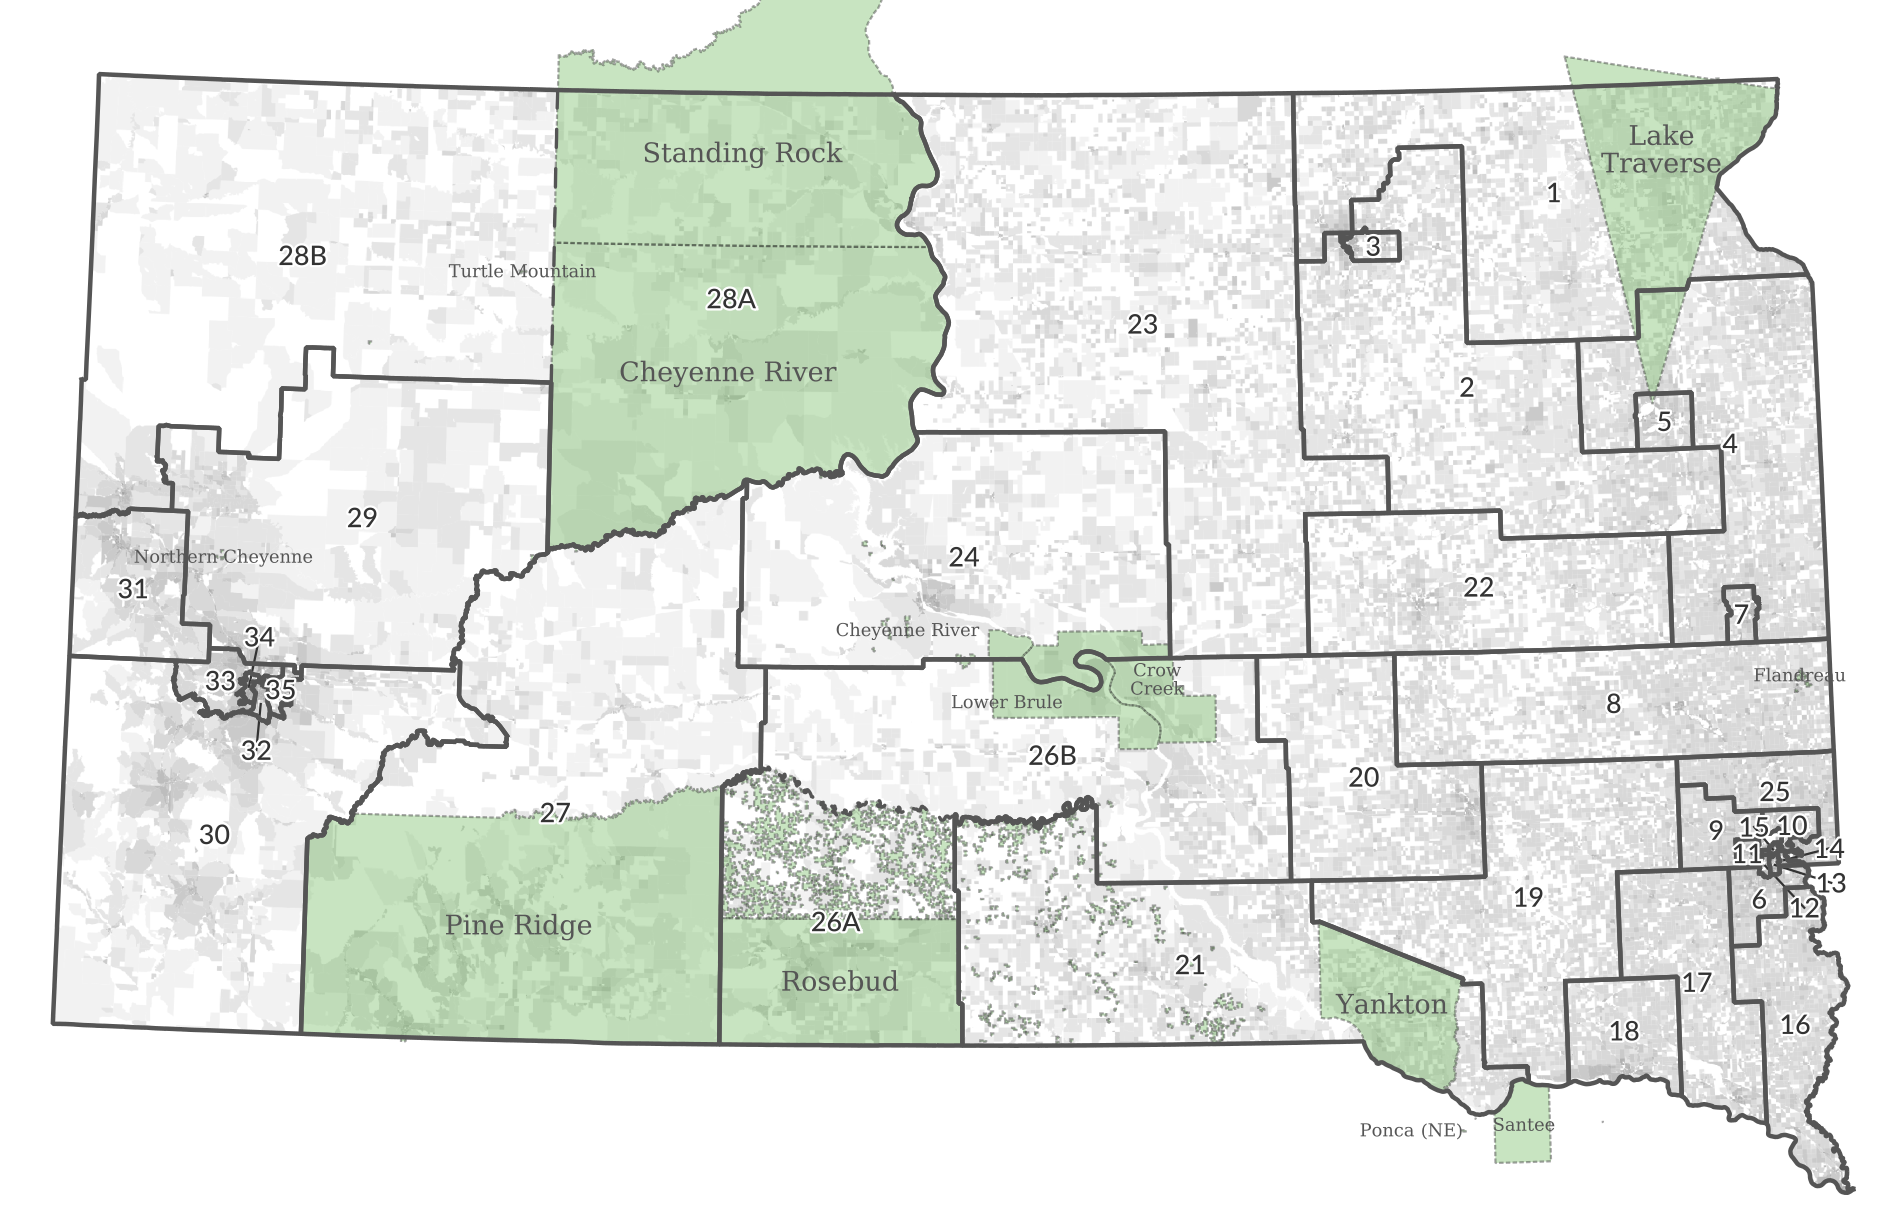
Legislative districts and indian reservations within South Dakota
These are
Majority-Minority Districts, and they're often made intentionally to create representation of minority areas that might otherwise be split up into districts in which they never make up a majority of the population. There's no requirement for these districts to exist, but since the algorithm doesn't take anything about who the voters are into account, it's up to chance whether Majority-Minority Districts will exist.
Overall, from these results I would conclude that partisan gerrymandering isn't really a common problem in the US. There have definitely been clear cases of it in the past, but none of the current maps seem wildly skewed in favor of one party in comparison to the algorithmic districts. The representation certainly isn't
proportional, but it's impossible to guaruntee a proportional legislature under a system of single-member constituencies. For example, if there were a state in which every precinct was 70% D voters and 30% R voters, it wouldn't matter how you distributed the precincts into districts, D would always win every seat. This is essentially the case in Hawaii, where under a
proportional electoral system, R would win around 16 of the 51 seats in the state house, while in both of my simulations they win none. It should be noted though that in reality R has 4 seats in that legislature, not none, partly due to the fact that the minority parties in states that lean heavily to one side are more moderate than that party at the national level, so the presidential election data I used doesn't reflect how the vote went for the local representatives in those districts.
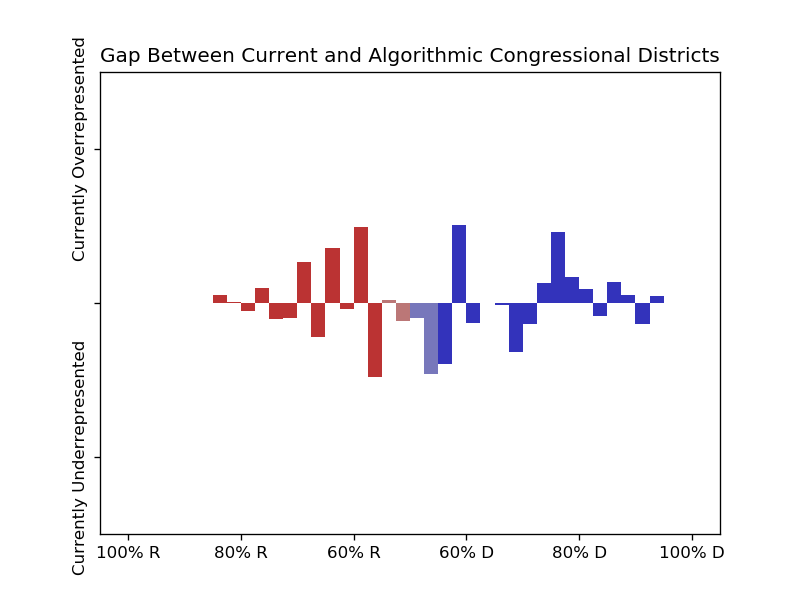
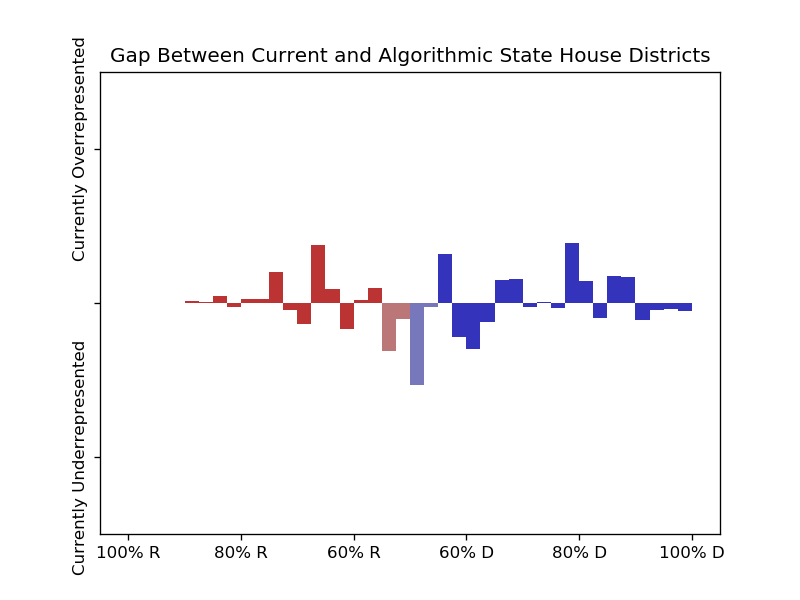
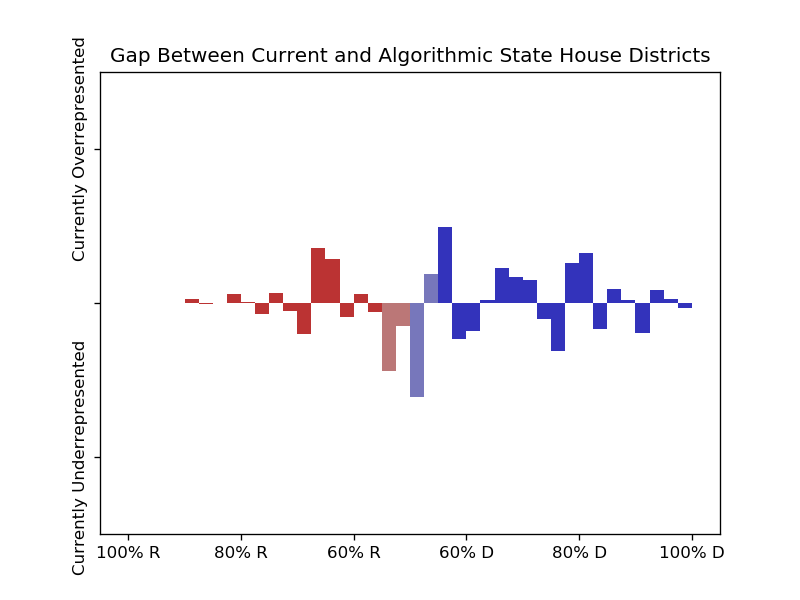
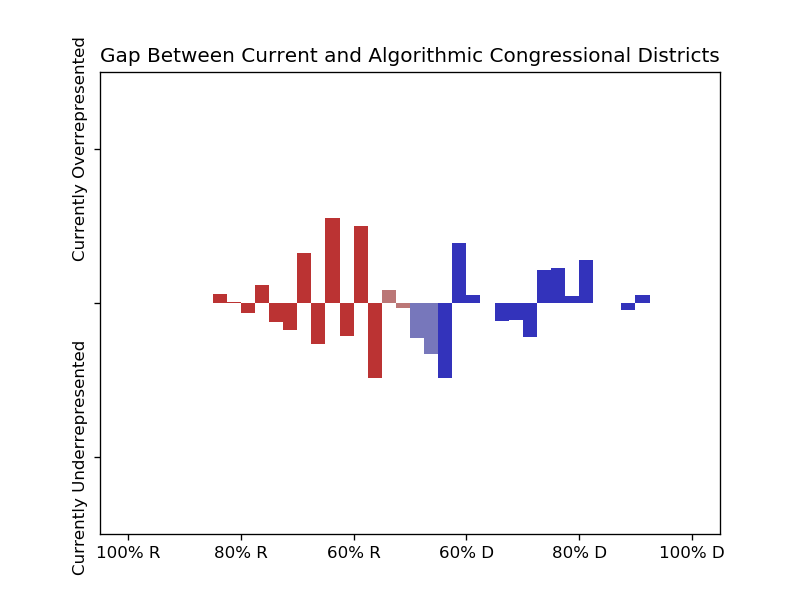
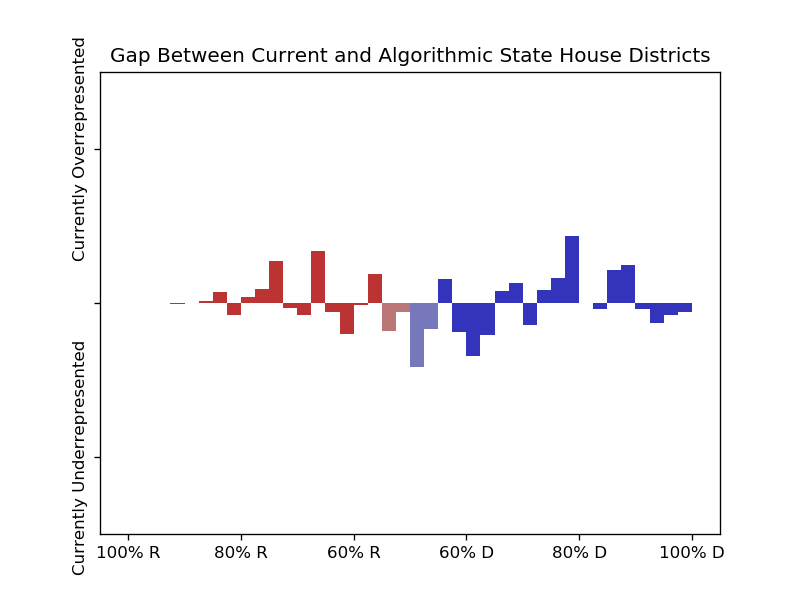
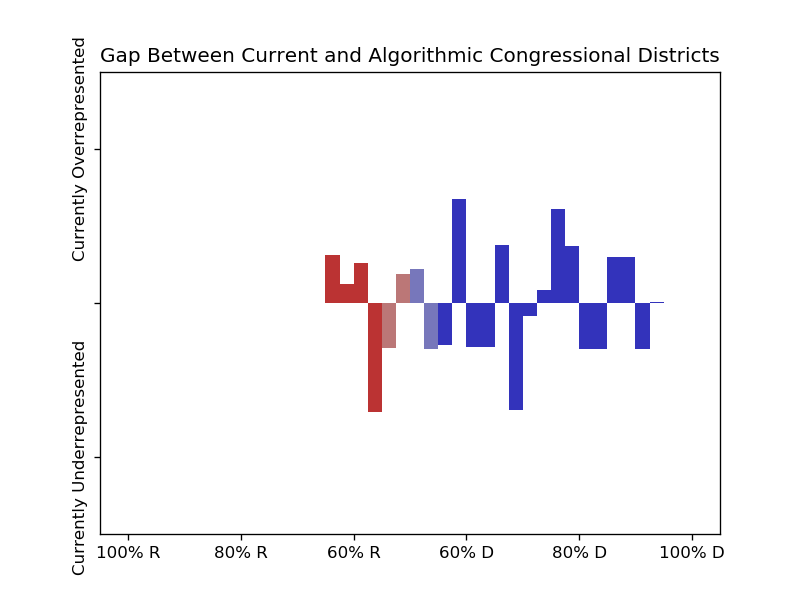
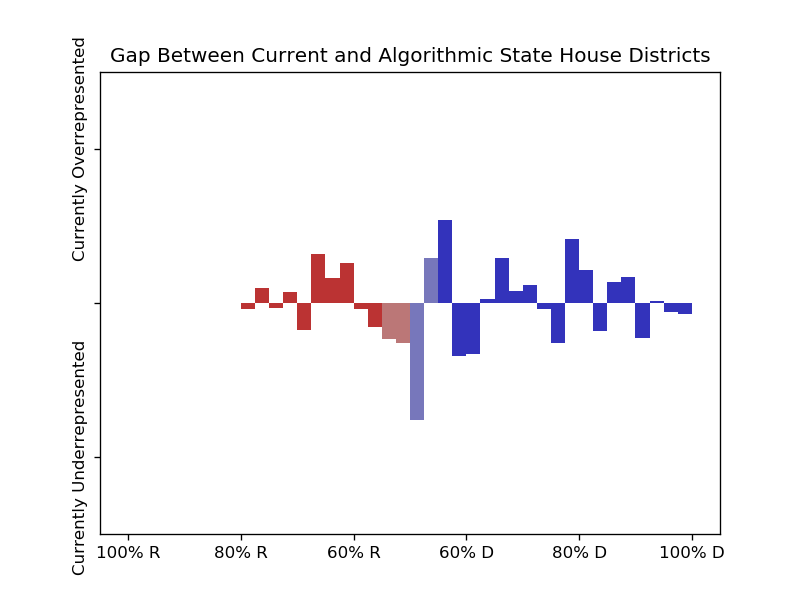
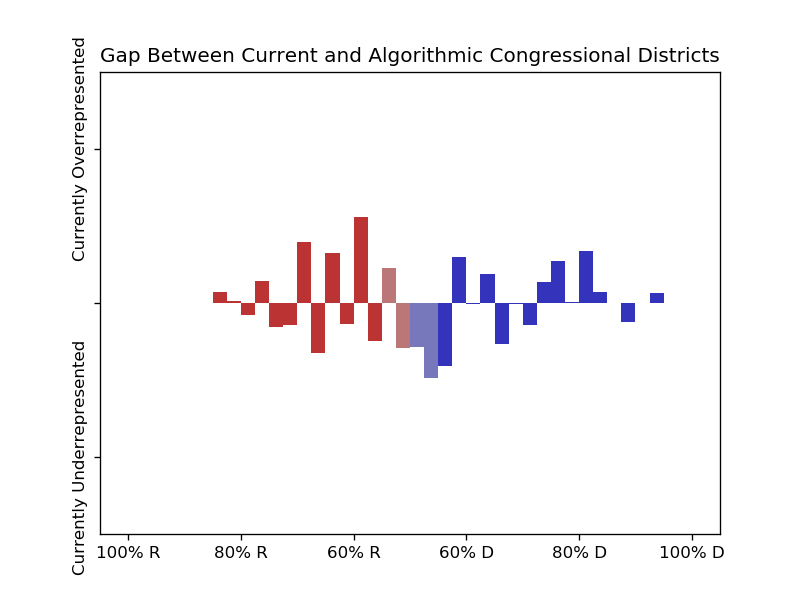
These graphs show how overrepresented districts of a given lean are within the current maps, if the algorithmically generated maps are to be taken as a baseline:
Histogram of all analysed states together, weighted by population.
With the current districts,
53.1% of people live in congressional districts that leaned towards R in the 2016 presidential election, and
50.5% live in state house districts that were within 10 points in that election.
In contrast, using the Balanced Centroidal Power Diagrams,
51.9% would live in R congressional districts, and
50.1% would live in R state house districts.
So the evidence of partisan gerrymandering, though there, appear to be limited to just a handful of districts, and I don't think these numbers are conclusive on their own. However, I found more solid evidence that in the algorithmically generated districts there are more competitive races, which indicates that the districts are gerrymandered in favor of safe races for incumbents of both parties, rather than just biased toward one side:
Under the current districts,
17.4% of people live in congressional districts that were within a 10 percentage point margin in the 2016 presidential election, and
15.8% live in state house districts that were within 10 points in that election.
With the Balanced Centroidal Power Diagrams,
21.6% would live in congressional districts within 10 points, and
19.3% would live in state house districts within 10 points.
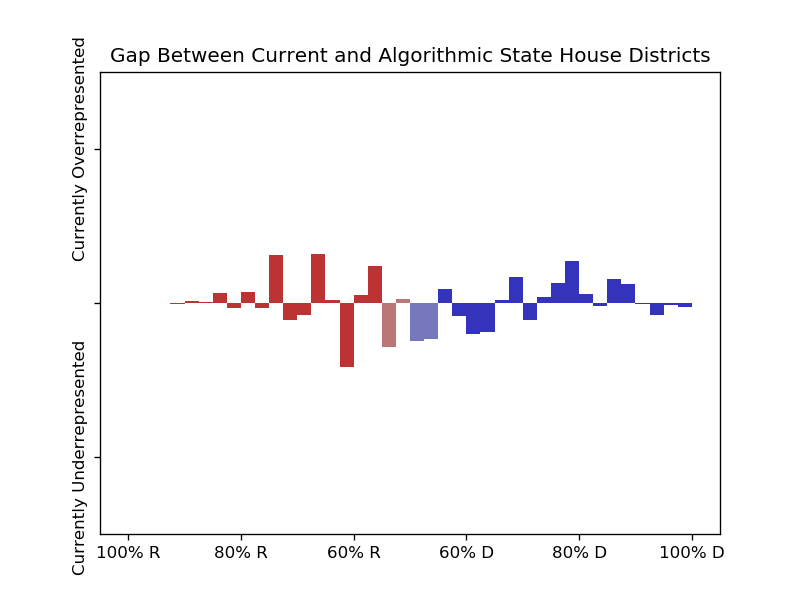
I've also tested this just with states that use independent redistricting commissions, though I didn't notice much difference between them and those that don't:
Only states with independent redistricting commissions.
Only states without independent redistricting commissions.
In either case, there are less people living in districts with competitive races than there would be with the algorithmically generated districts, so it doesn't seem to me that having independent redistricting commissions eliminates the incumbent bias.
In terms of partisan lean, D is overrepresented in states that have independent redistricting commissions while R is overrepresented in states that don't, in all cases by 1 or 2 percentage points. There are a few possible reasons for this—it may be that the commissions try to create more Majority-Minority districts, which typically lean for D—but since states with these commissions mostly lean D anyway it seems to just be that current districts are biased in favor of the majority party in a state, whether or not the districts were drawn up by the legislators or not.
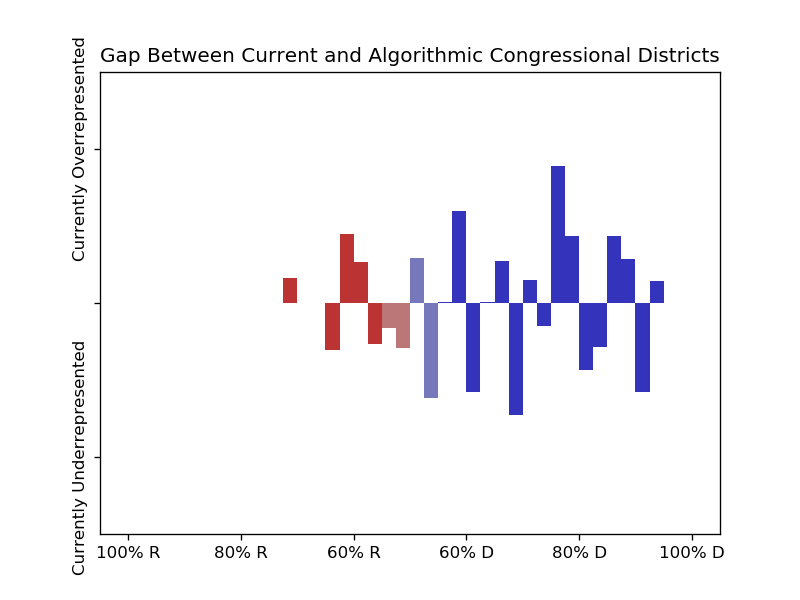
These final charts show the bias in just states that voted D in 2016 and just states that voted R in 2016:
Only states that voted D.
Only states that voted R.
District maps drawn with the Balanced Centroidal Power Diagrams overall create more mixed legislatures, and could potentially make them more proportional than hiring an independent commission would. However, if proportionality is the goal, then a more substantial change to the way we run our elections is necessary, such as adopting a system like
MMP, which could alleviate the risk of losing proper geographic and minority representation. Just implementing independent commissions or an algorithm for redistricting can't ensure that the resulting legislature will accurately represent the electorate.