You may have seen the following two map projections compared in the past:
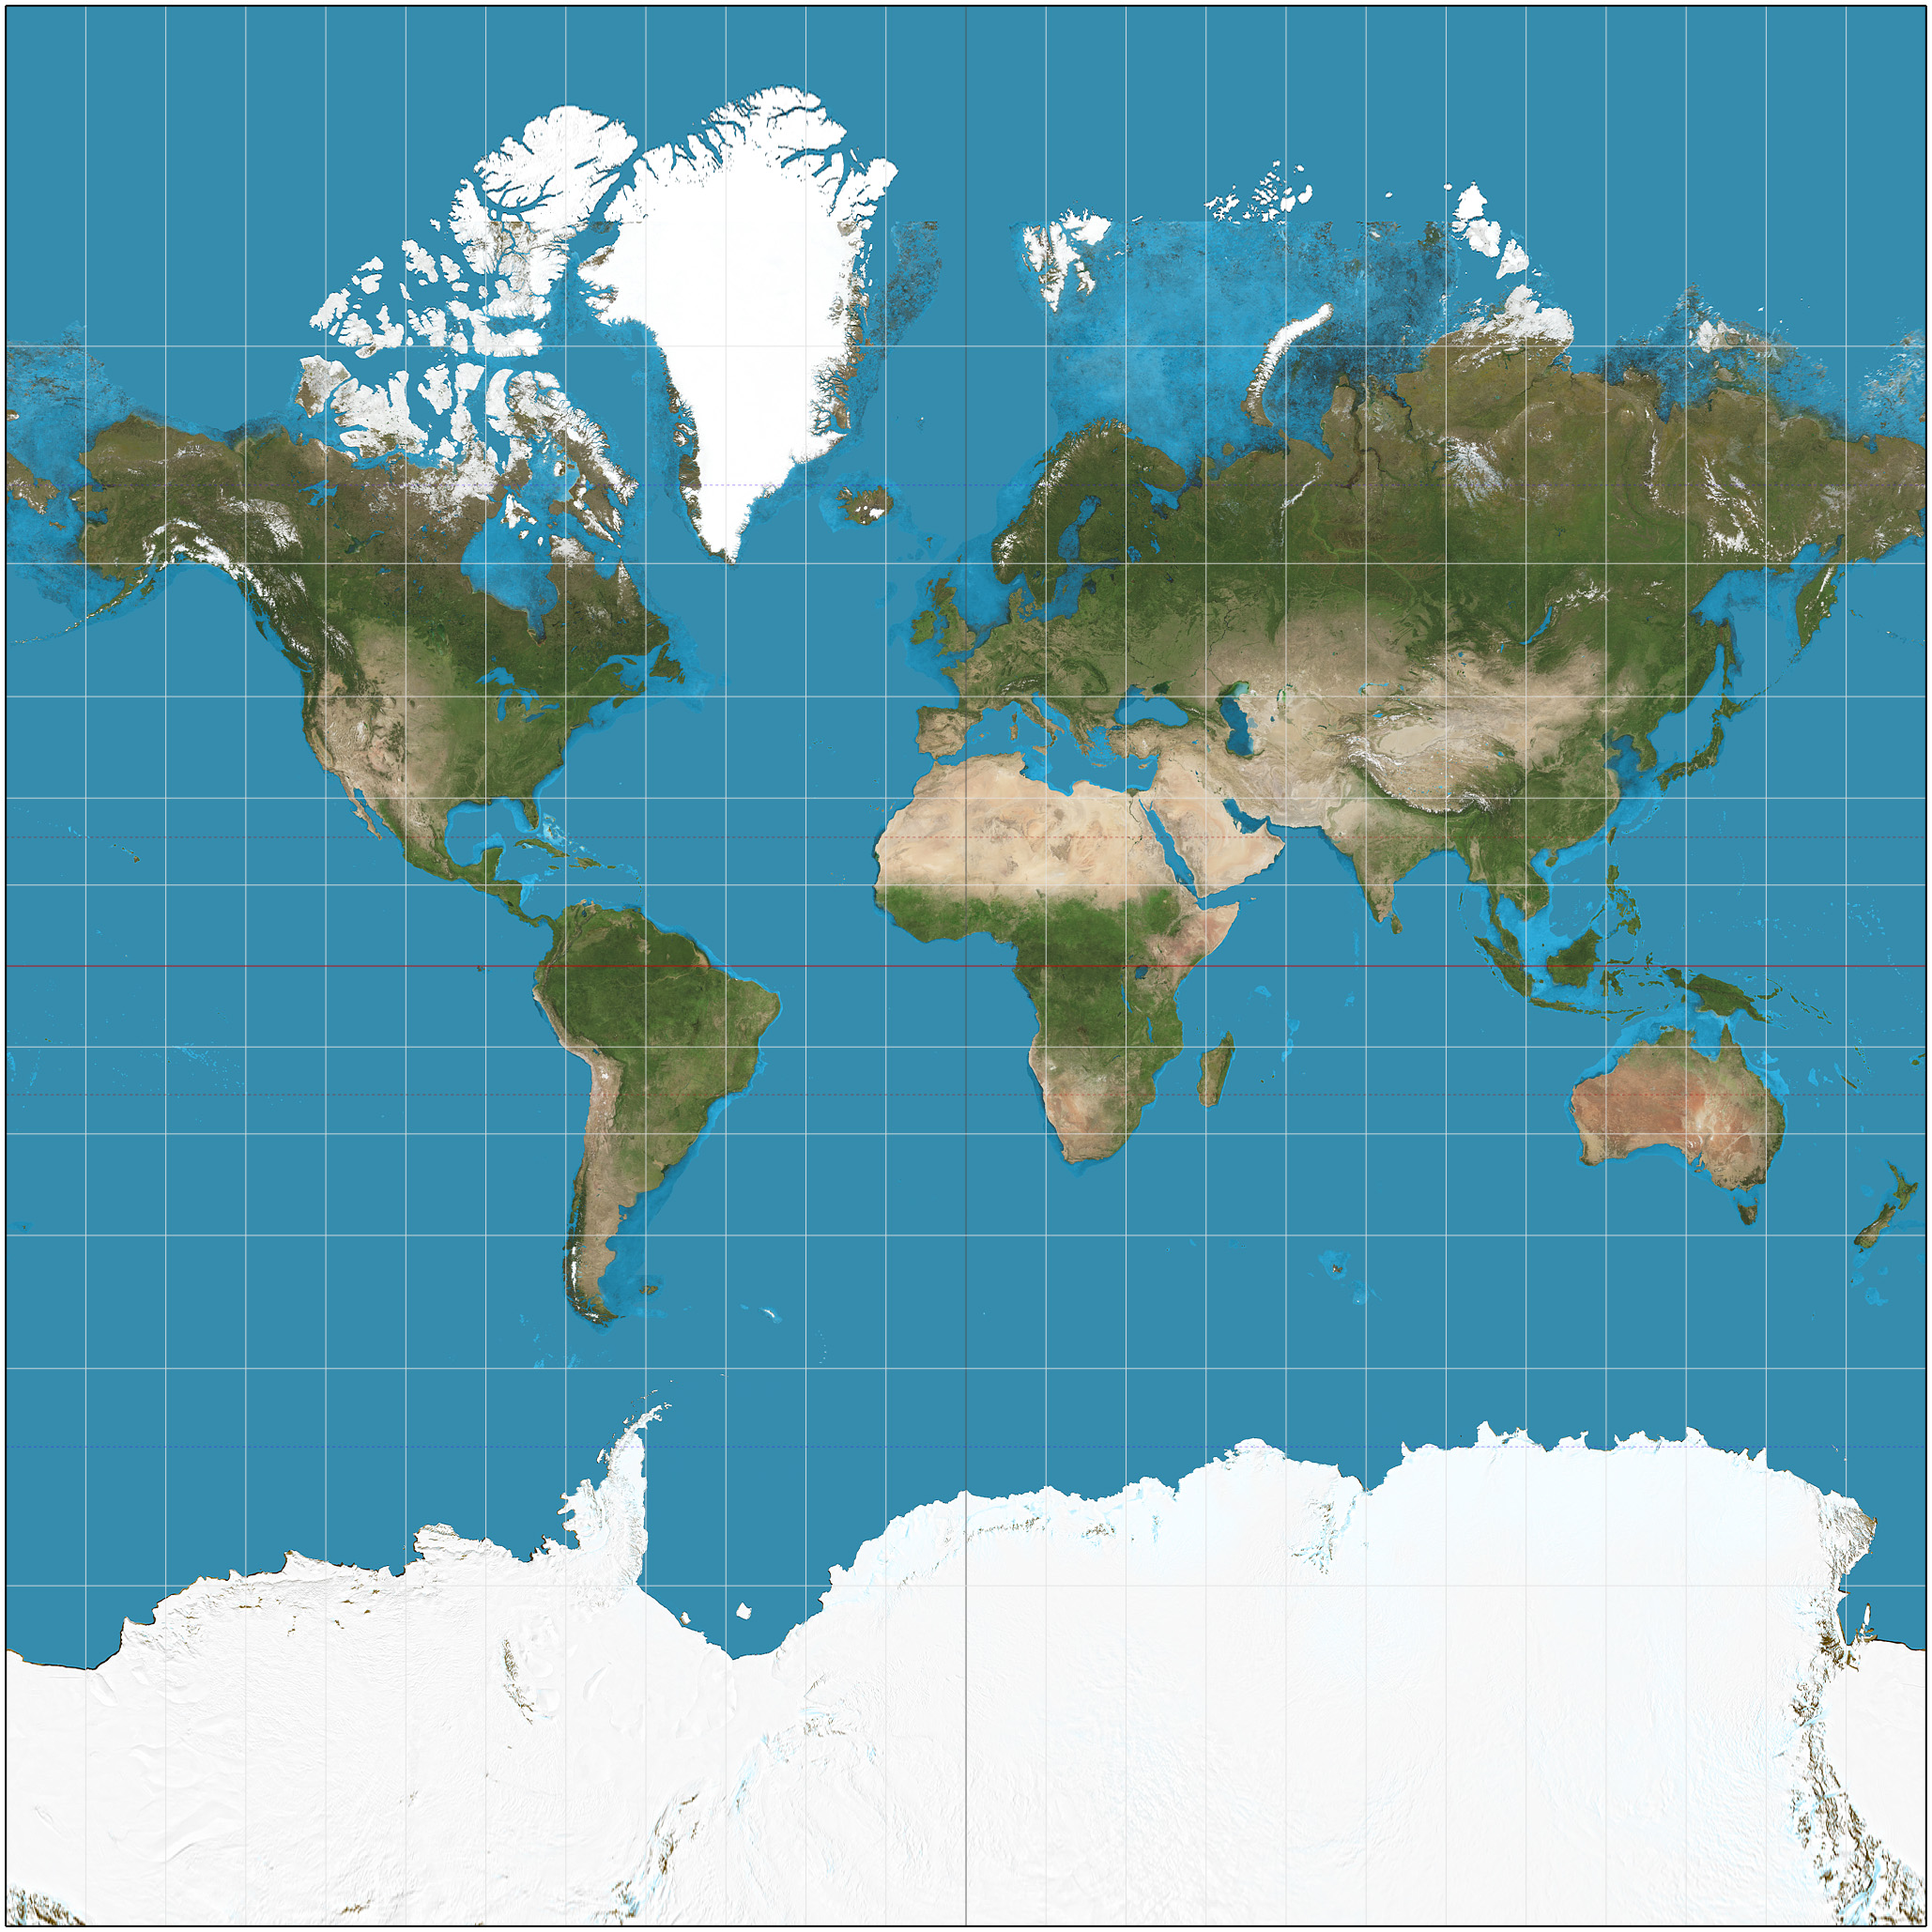
Left: The Mercator Projection, Right: The Gall-Peters Projection
The Mercator projection, which has been widely criticized for how it distorts the sizes of landmasses around the poles, famously making Greenland appear to be the size of Africa, and the Gall-Peters projection, which is hideous. The problem with the Gall-Peters projection is not that it's inaccurate—it does manage to maintain the correct areas and proportions of areas in a rectangular map—rather, what the Gall-Peters lacks in consistency in shape. The Mercator projection maintains shape quite well. The debate that has sprung up over these maps has made the claim that the Mercator should be phased out from schools in favor of the Gall-Peters so that kids won't grow up getting a warped perspective of the relative sizes of different countries. What I intend to demonstrate it that the Gall-Peters projection is not at all the best projection for this purpose.
To get a stricter understanding of how these maps distort things, imagine a circle were drawn somewhere on a globe and transformed with the projection. It would remain a circle on the Mercator, while on the Gall-Peters, it would become elliptical, stretching vertically around the equator and horizontally around the poles. This is the concept behind Tissot's indicatrices, usually seen as circles overlaid on a projection to display its warping. Ideally, each indicatrix represents the distortion at an infinitesimal point, but it can be understood as how much a tiny perfect circle drawn at any given point would theoretically stretch once the globe was projected onto a map.
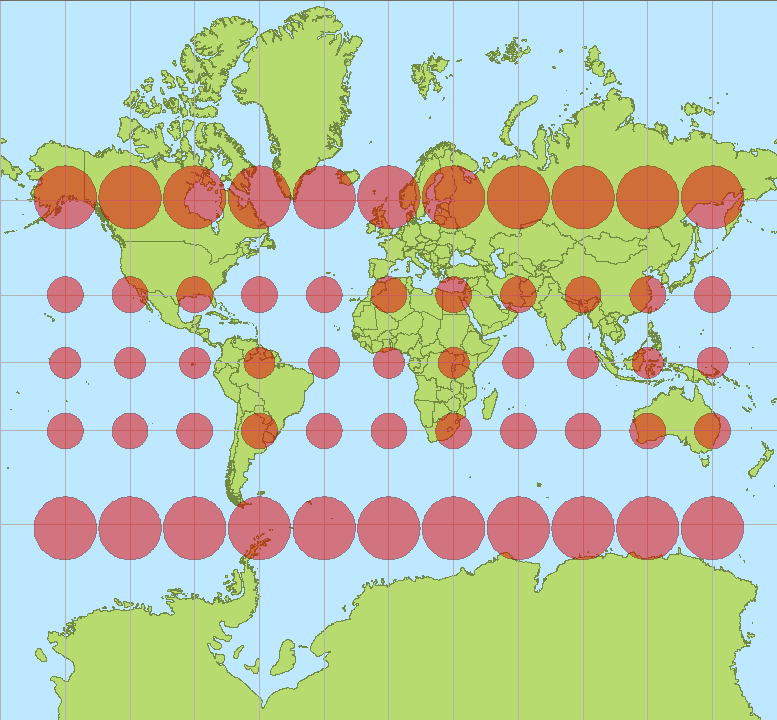

As the indicatrices show, the Mercator projection does not cause any distortion of shape, while the Gall-Peters causes a significant amount of stretching, especially around to equator and poles.
The distortion can be mathematically described from the differentials of the functions $x(\lambda,\varphi)$ and $y(\lambda,\varphi)$ that describe a projection, where $\lambda$ and $\varphi$ are longitude and latitude respectively.
The longitudinal and latitudinal change in scale, represented by $h$ and $k$ respectively, can be calculated as follows:
$$h=\sqrt{(\frac{\partial x}{\partial \varphi})^{2}+(\frac{\partial y}{\partial \varphi})^{2}}$$
$$k=\frac{1}{\cos{\varphi}}\sqrt{(\frac{\partial x}{\partial \lambda})^{2}+(\frac{\partial y}{\partial \lambda})^{2}}$$
The Mercator projection can be defined by the functions
$$x=\lambda$$
$$y=\ln{\tan{(\frac{\pi}{4}+\frac{\varphi}{2})}}$$
Evaluating $h$ and $k$ for the Mercator projection,
$$h=\sqrt{(0)^{2}+(\frac{1}{2\sin{(\frac{\pi}{4}+\frac{\varphi}{2})}\cos{(\frac{\pi}{4}+\frac{\varphi}{2})}})^{2}}=\sqrt{(0)^{2}+(\frac{1}{\cos{\varphi}})^{2}}=\frac{1}{\cos{\varphi}}$$
$$k=\frac{1}{\cos{\varphi}}\sqrt{(1)^{2}+(0)^{2}}=\frac{1}{\cos{\varphi}}$$
Thus, the ratio $h/k$ equals $1$ at every point, and Tissot's indicatrices remain circular. The projection has no local distortion of shape, which is why it is so helpful for navigation and is used by Google Maps. No matter where you zoom in, things will look about the same as they would on a globe. As for the Gall-Peters projection,
$$x=\lambda$$
$$y=2\sin{\varphi}$$
Evaluating $h$ and $k$,
$$h=\sqrt{(0)^{2}+(2\cos{\varphi})^{2}}=2\cos{\varphi}$$
$$k=\frac{1}{\cos{\varphi}}\sqrt{(1)^{2}+(0)^{2}}=\frac{1}{\cos{\varphi}}$$
The ratio $h/k$ now equals $2\cos^{2}{\varphi}$, meaning the distortion ranges from being stretched by a factor of two at the equator to unbounded horizontal stretching at the poles. The only parts where tissot's indicatrices remain circular is at $45°$ latitude.
Some stretching may be necessary for any map projection that intends to keep areas accurate, but surely we can do better than this, right?
The Gall-Peters is only one member of a family of cylindrical equal-area projections, though it's really just one map stretched vertically. A general formula for these projections is thus
$$x=S\lambda$$
$$y=\sin{\varphi}$$
Once again evaluating $h$ and $k$,
$$h=\sqrt{(0)^{2}+(\cos{\varphi})^{2}}=\cos{\varphi}$$
$$k=\frac{1}{\cos{\varphi}}\sqrt{(S)^{2}+(0)^{2}}=\frac{S}{\cos{\varphi}}$$
Thus, $h/k=\cos^{2}{\varphi}/S$, and the indicatrices remain circular at the latitude $\varphi=\cos^{-1}{\sqrt{S}}$. This latitude is known as the latitude of the standard parallels, and will be represented by $\varphi_{0}$. From this, the formulas can be rewritten as
$$x=\lambda\sin{\varphi_{0}}$$
$$y=\frac{\sin{\varphi}}{\sin{\varphi_{0}}}$$
The ratio $h/k$ equals $\cos^{2}{\varphi}/\cos^{2}{\varphi_{0}}$. I want to minimize the total amount of distortion on a generalized map, so to do this I need the surface integral of $\mathopen|\ln{h/k}\mathclose|$ across the globe:
$$\int_{0}^{2\pi} \int_{\frac{-\pi}{2}}^{\frac{\pi}{2}} \mathopen|\ln{\frac{\cos^{2}{\varphi}}{\cos^{2}{\varphi_{0}}}}\mathclose| d\varphi d\theta$$
To find the value of $\varphi_{0}$ that minimizes the total distortion, I then need to solve for $\varphi_{0}$ when
$$0=\frac{d}{d\varphi_{0}}\int_{0}^{2\pi} \int_{\frac{-\pi}{2}}^{\frac{\pi}{2}} \mathopen|\ln{\frac{\cos^{2}{\varphi}}{\cos^{2}{\varphi_{0}}}}\mathclose| d\varphi d\theta$$
From this, a minimum can be shown to exist at $\varphi_{0}=\pi/6$,
[1]Left as an exercise to the reader. which translates to a standard parallel lying at $30°$ latitude. This projection has its own name: The Behrmann projection.
In my opinion, this projection looks much more balanced than the Gall-Peters, especially with how the standard parallels exactly divide the hemispheres on the map. It really does annoy me just how prevalent the Gall-Peters projection is given that it's objectively worse than other equal area projections, though the choice of using $\mathopen|\ln{h/k}\mathclose|$ as a metric for distortion may be somewhat arbitrary. Given that so much hate for the Gall-Peters is based simply on the fact that it's ugly and really distorts shapes, it might as well be replaced with something that can mitigate that at least a little.
The Gall-Peters projection has been promoted by UNESCO, who claimed in 1991 that "the maximum shape distortion on the Peters map is never more than 2:1, compared with a 4:1 distortion of Europe on the Mercator map", which is false.
[2]Quote source: https://unesdoc.unesco.org/ark:/48223/pf0000088517 The limit of 2:1 distortion is true at the equator, but the poles see significantly more, while the figure cited for the distortion on the Mercator is entirely false, unless the writer conflated size distortion with distortion of shape. The projection was even adopted by the Boston Public School District in 2017 to replace the Mercator. Meanwhile, the Behrmann projection doesn't even register on Google Trends when compared to Gall-Peters, and other equal-area projections like the Hobo-Dyer hardly compare either, which shows just how much the projection debate failed to take an objective look at what makes any projection better and the full range of what's available.